Over the course of history, the structure of societies
and the relations between different societies have been shaped to a great
extent by the flow of information in them [9]. More recently, over the last 15-20
years, there has been interest not just in observing these flows, but also in
influencing and creating them. Doing this requires a deep understanding of the
macro- and micro-level structures involved, and this in turn has focused
attention on modeling and predicting these flows. This paper studies the
propagation of discussion topics from person to person through the social
network represented by the space of all weblogs. The mainstream adoption of
the Internet and Web has changed the physics of information diffusion. Until a
few years ago, the major barrier for someone who wanted a piece of information
to spread through a community was the cost of the technical infrastructure
required to reach a large number of people. Today, with widespread access to
the Internet, this bottleneck has largely been removed. In this context,
personal publishing modalities such as weblogs have become
prevalent. Weblogs, or ``blogs,'' are personal online diaries managed by
easy-to-use software packages that allow single-click publishing of daily
entries. The contents are observations and discussions ranging from the
mainstream to the startlingly personal. There are several million weblogs in
existence today. Unlike earlier mechanisms for spreading information at the
grassroots level, weblogs are open to frequent widespread observation, and
thus offer an inexpensive opportunity to capture large volumes of information
flows at the individual level. Furthermore, recent electronic publication
standards allow us to gather dated news articles from sources such as Reuters
and the AP Newswire in order to analyze weblogs in the context of current
affairs; these sources have enormous influence on the content of
weblogs. Weblogs typically manifest significant interlinking, both within
entries, and in boilerplate matter used to situate the weblog in a
neighborhood of other weblogs that participate in the same distributed
conversation. Kumar et al. [19]
analyze the ``burstiness'' of blogs, capturing bursts of activity within blog
communities based on an analysis of the evolving link structure. Here, we
focus instead on the propagation of topics from one blog to the next, based on
the text of the weblog rather than its hyperlinks. Using this information, we
seek to characterize information diffusion along two dimensions:
- Topics:
- We are interested in first identifying the set of postings that
are about some topic, and then characterizing the different
patterns into which the collection of postings about the topic may
fall. We propose that topics are mostly composed of a union of
chatter (ongoing discussion whose subtopic flow is largely
determined by decisions of the authors) and spikes
(short-term, high-intensity discussion of real-world events that
are relevant to the topic). We develop a model to capture this
observed structure.
- Individuals:
- Though the advent of personal publication gives everyone the
same reach, individual behavior differs dramatically. We begin by
characterizing four categories of individuals based on their
typical posting behavior within the life cycle of a topic. We then
develop a model for information diffusion based on the theory of
the spread of infectious diseases; the parameters of the model
capture how a new topic spreads from blog to blog. We give an
algorithm to learn the parameters of the model based on real data,
and apply the algorithm to real (and synthetic) blog data. As a
result, we are able to identify particular individuals who are
highly effective at contributing to the spread of ``infectious''
topics.
There is a rich literature around propagation through networks that
is relevant to our work, from a variety of fields ranging from
thermodynamics to epidemiology to marketing. We provide here a
broad survey of the area, with pointers to more detailed survey
works where possible, and give some details around recent work in
disease propagation that is closest in spirit to the models we
present.
Much previous research investigating the flow of information
through networks has been based upon the analogy between the spread
of disease and the spread of information in networks. This analogy
brings centuries of study of epidemiology to bear on questions of
information diffusion. (See, for example, the book of Bailey
[4] for some of the extensive
work in this field.) Classical disease-propagation models in
epidemiology are based upon the cycle of disease in a host: a
person is first susceptible (S) to the disease. If then
exposed to the disease by an infectious contact, the person becomes
infected (I) (and infectious) with some probability.
The disease then runs its course in that host, who is subsequently
recovered (R) (or removed, depending on the virulence
of the disease). A recovered individual is immune to the disease
for some period of time, but the immunity may eventually wear off.
Thus SIR models diseases in which recovered hosts are never
again susceptible to the disease--as with a disease conferring
lifetime immunity, like chicken pox, or a highly virulent disease
from which the host does not recover--while SIRS models the
situation in which a recovered host eventually becomes susceptible
again, as with influenza. In blogspace, one might interpret the
SIRS model as follows: a blogger who has not yet written about a
topic is exposed to the topic by reading the blog of a friend. She
decides to write about the topic, becoming infected. The topic may
then spread to readers of her blog. Later, she may revisit the
topic from a different perspective, and write about it again.
Girvan et al. [11] study a SIR model
with mutation, in which a node u is immune to any
strain of the disease which is sufficiently close to a strain with
which u was previously infected. They observe that for
certain parameters it is possible to generate periodic outbreaks,
in which the disease oscillates between periods of epidemic
outbreak and periods of calm while it mutates into a new form. In
blogspace, one could imagine the mutation of Arnold qua
movie star into Arnold qua governor. (We observe this kind
of ebb and flow in the popularity of various ``spiky chatter''-type
memes. See Section ![[*]](p417-gruhl-crossref.png) .) Early
studies of propagation took place on ``fully mixed'' or
``homogeneous'' networks in which a node's contacts are chosen
randomly from the entire network. Recent work, however, focuses on
more realistic models based on social networks. In a model of
small-world networks defined by Watts and Strogatz [28], Moore and Newman [21] are able to calculate the
minimum transmission probability for which a disease will spread
from one seed node to infect a constant fraction of the entire
network (known as the epidemic threshold). We now review
some previous research on epidemic spreading on networks that
follow a power law, in which the probability that the degree
of a node is k is proportional to
k-
.) Early
studies of propagation took place on ``fully mixed'' or
``homogeneous'' networks in which a node's contacts are chosen
randomly from the entire network. Recent work, however, focuses on
more realistic models based on social networks. In a model of
small-world networks defined by Watts and Strogatz [28], Moore and Newman [21] are able to calculate the
minimum transmission probability for which a disease will spread
from one seed node to infect a constant fraction of the entire
network (known as the epidemic threshold). We now review
some previous research on epidemic spreading on networks that
follow a power law, in which the probability that the degree
of a node is k is proportional to
k- , for
a constant
, for
a constant  typically between 2
and 3. Many real-world networks have this property [20], including the social network
defined by blog-to-blog links [19]. Pastor-Satorras and
Vespignani [25]
analyze an SIS model of computer virus propagation in power-law
networks, showing that--in stark contrast to random or regular
networks--the epidemic threshold is zero, so an epidemic
will always occur. These results can be interpreted in terms of the
robustness of the network to random edge failure, as follows.
Suppose that each edge in the network is deleted independently with
probability
(1 -
typically between 2
and 3. Many real-world networks have this property [20], including the social network
defined by blog-to-blog links [19]. Pastor-Satorras and
Vespignani [25]
analyze an SIS model of computer virus propagation in power-law
networks, showing that--in stark contrast to random or regular
networks--the epidemic threshold is zero, so an epidemic
will always occur. These results can be interpreted in terms of the
robustness of the network to random edge failure, as follows.
Suppose that each edge in the network is deleted independently with
probability
(1 -  ); we consider the
network ``robust'' if most of the nodes are still connected. It is
easy to see that nodes that remain in the same component as some
initiator v0 after the edge deletion process are
exactly the same nodes that v0 infects according
to the disease transmission model above. This question has been
considered from the perspective of error tolerance of
networks like the Internet: what happens to the network if a random
(1 - )-fraction of the
links in the Internet fail? Many researchers have observed that
power-law networks exhibit extremely high error tolerance [2,6]. In blogspace, however,
many topics propagate without becoming epidemics, so such a model
would be inappropriate. One refinement is to consider a more
accurate model of power-law networks. Eguíluz and Klemm
[10] have demonstrated a
non-zero epidemic threshold under the SIS model in power-law
networks produced by a certain generative model that takes into
account the high clustering coefficient--the probability
that two neighbors of a node are themselves neighbors--found in
real social networks [28]. Another refinement is to
modify the transmission model. Wu et al. [30] consider the flow of
information through real and synthetic email networks under a model
in which the probability of infection decays as the distance to the
initiator v0 increases. They observe that meme
outbreaks under their model are typically limited in scope--unlike
in the corresponding model without decay, where the epidemic
threshold is zero--exactly as one observes in real data. Newman et
al. [24] have also
empirically examined the simulated spread of email viruses by
examining the network defined by the email address books of a user
community. Finally, Newman [23] is able
to calculate properties of disease outbreaks, including the
distribution of outbreak sizes and the epidemic threshold, for an
SIR model of disease propagation.
The spread of a piece of information through a social network can
also be viewed as the propagation of an innovation through
the network. (For example, the URL of a website that provides an
new, valuable service is such a piece of information.) In the field
of sociology, there has been extensive study of the diffusion of
innovation in social networks, examining the role of word of
mouth in spreading innovations. At a particular point in time,
some nodes in the network have adopted the innovation, and others
have not. Two fundamental models for the process by which nodes
adopt new ideas have been considered in the literature:
); we consider the
network ``robust'' if most of the nodes are still connected. It is
easy to see that nodes that remain in the same component as some
initiator v0 after the edge deletion process are
exactly the same nodes that v0 infects according
to the disease transmission model above. This question has been
considered from the perspective of error tolerance of
networks like the Internet: what happens to the network if a random
(1 - )-fraction of the
links in the Internet fail? Many researchers have observed that
power-law networks exhibit extremely high error tolerance [2,6]. In blogspace, however,
many topics propagate without becoming epidemics, so such a model
would be inappropriate. One refinement is to consider a more
accurate model of power-law networks. Eguíluz and Klemm
[10] have demonstrated a
non-zero epidemic threshold under the SIS model in power-law
networks produced by a certain generative model that takes into
account the high clustering coefficient--the probability
that two neighbors of a node are themselves neighbors--found in
real social networks [28]. Another refinement is to
modify the transmission model. Wu et al. [30] consider the flow of
information through real and synthetic email networks under a model
in which the probability of infection decays as the distance to the
initiator v0 increases. They observe that meme
outbreaks under their model are typically limited in scope--unlike
in the corresponding model without decay, where the epidemic
threshold is zero--exactly as one observes in real data. Newman et
al. [24] have also
empirically examined the simulated spread of email viruses by
examining the network defined by the email address books of a user
community. Finally, Newman [23] is able
to calculate properties of disease outbreaks, including the
distribution of outbreak sizes and the epidemic threshold, for an
SIR model of disease propagation.
The spread of a piece of information through a social network can
also be viewed as the propagation of an innovation through
the network. (For example, the URL of a website that provides an
new, valuable service is such a piece of information.) In the field
of sociology, there has been extensive study of the diffusion of
innovation in social networks, examining the role of word of
mouth in spreading innovations. At a particular point in time,
some nodes in the network have adopted the innovation, and others
have not. Two fundamental models for the process by which nodes
adopt new ideas have been considered in the literature:
- Threshold models [14]. Each node
u in the network chooses a threshold
tu
 [0, 1],
typically drawn from some probability distribution. Every neighbor
v of u has a nonnegative connection weight
wu, v so that
[0, 1],
typically drawn from some probability distribution. Every neighbor
v of u has a nonnegative connection weight
wu, v so that
 wu,
v
wu,
v 1, and u adopts if and
only if
tu
1, and u adopts if and
only if
tu w
u, v.
w
u, v.
- Cascade models [13]. Whenever a social
contact
v
 (u) of a node u adopts, then u
adopts with some probability pv, u. (In other
words, every time a person close to a person u adopts, there
is a chance that u will decide to ``follow'' v and
adopt as well.)
(u) of a node u adopts, then u
adopts with some probability pv, u. (In other
words, every time a person close to a person u adopts, there
is a chance that u will decide to ``follow'' v and
adopt as well.)
In the Independent Cascade model of Goldenberg, Eitan, and
Muller [13], we are
given a set of N nodes, some of which have already adopted.
At the initial state, some non-empty set of nodes are
``activated.'' At each successive step, some (possibly empty) set
of nodes become activated. The episode is considered to be over
when no new activations occur. The set of nodes are connected in a
directed graph with each edge (u, v) labeled with a
probability pu, v. When node u is
activated in step t, each node v that has an arc
(u, v) is activated with probability pu,
v. This influence is independent of the history of all other
node activations. (If v is not activated in that time step,
then u will never activate v.) The General Cascade
model of Kempe, Kleinberg, and Tardos [17] generalizes the Independent Cascade
model--and also simultaneously generalizes the threshold models
described above--by discharging the independence assumption. Kempe
et al. are interested in a related problem on social networks
with a marketing motivation: assuming that innovations propagate
according to such a model, and given a number k, find the
k ``seed'' nodes S * k
that maximize the expected number of adopters of the innovation if
S * k adopt initially. (One
can then give free samples of a product to S
* k, for example.)
The propagation of information through a social network has also
been studied from a game-theoretic perspective, in which one
postulates an increase in utility for players who adopt the new
innovation or learn the new information if enough of their friends
have also adopted. (For example, each player chooses whether to
switch from video tape to DVDs; a person with friends who have made
the same choice can benefit by borrowing movies.) In blogspace,
sharing discussion of a new and interesting topic with others in
one's immediate social circle may bring pleasure or even increased
status. Morris [22]
and Young [31] consider a
setting like the following coordination game: in every time step,
each node in a social network chooses a type {0, 1}. Here we
interpret players of type one to have adopted the meme. Each player
i receives a positive payoff for each of its neighbors that
has the same type as i, in addition to an intrinsic benefit
that i derives from its type. (Each player may have a
distinct utility for adopting, depending on his inherent interest
in the topic.) Suppose that all but a small number of players
initially have type 0. Morris and Young explore the question of
whether type 1's can ``take over'' the graph if every node chooses
to switch to type 0 with probability increasing as the number of
i's neighbors that are of type 0 increases. There has also
been work in the economics community on models of the growth of
social networks when an agent u can selfishly decide to form
a link with another agent v, who may have information that
u desires to learn. There is a cost borne by u
to establishing such a link, and a profit for the
information which u learns through this link. This research
explores properties of the social network which forms under this
scenario [5,16].
3 Corpus Details
One of the challenges in any study involving tens of thousands of
publishers is the tracking of individual publications. Fortunately
for us, most of the publishers, including the major media sources,
now provide descriptions of their publications using RSS
(rich site summary, or, occasionally, really simple
syndication) [18].
RSS, which was originally developed to support the personalization
of the Netcenter portal, has now been adopted by the weblog
community as a simple mechanism for syndication. In the present
work, we focus on RSS because of its consistent presentation of
dates--a key feature for this type of temporal tracking. Our corpus
was collected by daily crawls of 11,804 RSS blog feeds. We
collected 2K-10K blog postings per day--Sundays were low,
Wednesdays high--across these blogs, for a total of 401,021
postings in our data set. (Each posting corresponds to an ``item''
entry in RSS.) Complementing this, we also crawled 14 RSS channels
from rss.news.yahoo.com hourly, to identify when
topics were being driven by major media or real-world events, as
opposed to arising within blogspace itself. The blog entries were
stored as parent/child entities in WebFountain [29] and analyzed with a half-dozen
special-purpose blog annotators to extract the various date formats
popular in RSS, convert to UTF8, detag, etc.
Figure: Number of blog
postings (a) by time of day and (b) by day of week, normalized to
the local time of the poster.
|
|
See Figure for the
profile of blog postings within a day and from day-to-day,
normalized by the poster's time zone. The most frequent posting is
at 10AM. There is a pronounced dip at 6 and 7PM (the commute home?
dinner? Must-See-TV?), an odd plateau between 2 and 3AM and a
global minimum at 5AM. Posting seems to peak midweek, and dips
considerably on weekends.
4 Characterization and Modeling of Topics
In this section, we explore the topics discussed in our
data. We differentiate between two families of models: (i)
horizon models, which aim to capture the long-term changes
(over the course of months, years, or even decades) in the primary
focus of discussion even as large chatter topics (like Iraq and
Microsoft, as of this writing) wax and wane; and (ii)
snapshot models, which focus on short-term behavior (weeks
or months) while the background ``chatter'' topics are assumed to
remain fixed. This paper explores snapshot models; we do not
address horizon models, but instead raise the issue as an
interesting open problem.
4.1 Topic Identification and Tracking
To support our goal of characterizing topic activity, we must first
find and track topics through our corpus. The field of topic
detection and tracking has studied this problem in depth for a
number of years--NIST has run a series of workshops and open
evaluation challenges [27];
see also, for example, [3]. Our
requirements are somewhat different from theirs; we require schemes
that provide views into a number of important topics at different
levels (very focused to very broad), but rather than either high
precision or high recall, we instead require that our detected set
contain good representatives of all classes of topics. We have thus
evaluated a range of simple techniques, chosen the ones that were
most effective given our goals, and then manually validated
different subsets of this broader set for use in particular
experiments. Our evaluations of these different techniques revealed
some unexpected gaps in our intuition regarding blogspace; we give
a brief walk-through here. First, we treated references to
particular websites as topics, in the sense that bloggers would
read about these ``interesting'' sites in another blog and then
choose to write about them. However, while there are over 100K
distinct links in our corpus, under 700 of them appear 10 times or
more--not enough to chart statistically significant information
flows. Next, we considered recurring sequences of words using
sequential pattern mining [1]. We discovered under 500
such recurrent sequences, many of which represented automatically
generated server text, or common phrases such as ``I don't think I
will'' and ``I don't understand why.'' We then turned to references
to entities defined in the TAP ontology [15]. This provided around 50K instances of
references to 3700 distinct entities, but fewer than 700 of these
entities occurred more than 10 times. The next two broader sets
provided us with most of the fodder for our experiments. We began
with a naive formulation of proper nouns: all repeated sequences of
uppercase words surrounded by lowercase text. This provided us with
11K such features, of which more than half occurred at least 10
times. Finally, we considered individual terms under a ranking
designed to discover ``interesting'' terms. We rank a term t
by the ratio of the number of times that t is mentioned on a
particular day i (the term frequency
tf(i)) to the average number of times t was
mentioned on previous days (the cumulative inverse document
frequency). More formally,
tfcidf(i) =
(i-1)tf(i)/ tf (j). Using a threshold
of
tf(i) > 10 and
tfcidf(i) > 3 we generate roughly 20,000 relevant
terms. All features extracted using any of these methods are then
spotted wherever they occur in the corpus, and extracted with
metadata indicating the date and blog of occurrence.
tf (j). Using a threshold
of
tf(i) > 10 and
tfcidf(i) > 3 we generate roughly 20,000 relevant
terms. All features extracted using any of these methods are then
spotted wherever they occur in the corpus, and extracted with
metadata indicating the date and blog of occurrence.
4.2 Characterization of Topic Structure
To understand the structure and composition of topics, we manually
studied the daily frequency pattern of postings containing a large
number of particular phrases. We analyzed the 12K individual words
most highly ranked under the tfcidf ranking described above. Most
of these graphs do not represent topics in a classical sense, but
many do. We hand-identified 340 classical topics, a sample of which
is shown in Table .
Table: Example topics identified during
manual scan.
| apple |
arianna |
ashcroft |
astronaut |
| blair |
boykin |
bustamante |
chibi |
| china |
davis |
diana |
farfarello |
| guantanamo |
harvard |
kazaa |
longhorn |
| schwarzenegger |
udell |
siegfried |
wildfires |
| zidane |
gizmodo |
microsoft |
saddam |
|
Next, based on our observations, we attempt to understand the
structure and dynamics of topics by decomposing them along two
orthogonal axes: internally driven, sustained discussion we call
chatter; and externally induced sharp rises in postings we
call spikes. We then refine our model by exploring the
decomposition of these spikes into subtopics, so that a topic can
be seen as the union of chatter and spikes about a variety of
subtopics.
4.2.1 Topic = Chatter + Spikes
There is a community of bloggers interested in any topic that
appears in postings. On any given day, some of the bloggers express
new thoughts on the topic, or react to topical postings by other
bloggers. This constitutes the chatter on that topic.
Occasionally, an event occurring in the real world induces a
reaction from bloggers, and we see a spike in the number of
postings on a topic. Spikes do not typically propagate through
blogspace, in the sense that bloggers typically learn about spikes
not from other blogs, but instead from a broad range of channels
including mainstream media. Thus, we can assume all informed
authors are aware of the topical event and have an opportunity to
write about it. On rare occasions, the chatter reaches
resonance, i.e., someone makes a posting to which everyone
reacts sharply, thereby causing a spike. The main characteristic of
resonance is that a spike arises from either no external input or a
very small external input. The formation of order (a spike) out of
chaos (chatter) has been observed in a variety of situations
[26], though observation of our
data reveals that this happens very rarely in blogspace. In fact,
the only sustained block re-posting meme that we observed in our
data consisted of the ``aoccdrnig to rscheearch at an elingsh
uinervtisy it deosn't mttaer in waht oredr the ltteers in a wrod
are, the olny iprmoetnt tihng is taht the frist and lsat ltteer is
at the rghit pclae'' story which came out of nowhere, spiked and
died in about 2 weeks (with most postings over a four-day period).
Depending on the average chatter level and pertinence of the topic
to the real world, topics can be roughly placed into one of the
following three categories, with examples shown in
Figure :
Figure: Three types of
topic patterns: the topic ``Chibi'' (green line with single spike
in center of graph) is Just Spike; ``Microsoft'' (blue line
with peaks and valleys throughout graph) is Spiky Chatter;
and ``Alzheimer's'' (red line with relatively flat content) is
Mostly Chatter.
|
|
- Just Spike:
- Topics which at some point during our collection window went
from inactive to very active, then back to inactive. These topics
have a very low chatter level. E.g., Chibi.
- Spiky Chatter:
- Topics which have a significant chatter level and which are
very sensitive to external world events. They react quickly and
strongly to external events, and therefore have many spikes. E.g.,
Microsoft.
- Mostly Chatter:
- Topics which were continuously discussed at relatively moderate
levels through the entire period of our discussion window, with
small variation from the mean. E.g., Alzheimer's.
Spiky Chatter topics typically have a fairly high level of chatter,
with the community responding to external world events with a
spike; their persistent existence is what differentiates Spiky
Chatter from spikes. They consist of a superposition of multiple
spikes, plus a set of background discussion unrelated to any
particular current event. For example, the Microsoft topic contains
numerous spikes (for example, a spike towards the end of our window
around a major announcement about Longhorn, a forthcoming version
of Windows) plus ongoing chatter of people expressing opinions or
offering diatribes regarding the company and its products.
4.2.2 Topic = Chatter + Spiky Subtopics
In this section, we refine our model of Topic = Chatter + Spikes by
examining whether the spikes themselves are decomposable.
Intuitively, the community associated with a topic can be seen as
randomly choosing a subtopic and posting about it. When an external
world event occurs, it is often particular to something very
specific--that is, a subtopic--especially for complex topics. In
this section, we consider a subtopic-based analysis using the
spikes in the complex, highly posted topic ``Microsoft'' as a case
study. Microsoft was especially appropriate for this analysis, as
several Microsoft-related events occurred during the collection of
our data set, including the announcement of blog support in
Longhorn. We used a multi-step process to identify some key terms
for this experiment. First, we looked at every proper noun x
that co-occurred with the target term ``Microsoft'' in the data.
For each we compute the support s (the number of times that
x co-occurred with the target) and the reverse confidence
cr : = P(target| x).
Thresholds for s and cr were manipulated
to generate rational term sets. As is common with these cases, we
do not have a hard-and-fast support and confidence algorithm, but
found that s in the range of 10 to 20 and
cr in the range of 0.10 to 0.25 worked well. For
the target ``Microsoft,'' this generates the terms found in
Table . Of course,
this is not a complete list of relevant subtopics, but serves
rather as a test set.
Table: Top coverage terms for Microsoft
spikes.
| windows |
server |
services |
longhorn |
| exchange |
ie |
office |
msdn |
| outlook |
msn |
gates |
redmond |
| eolas |
xp |
netscape |
powerpoint |
| scoble |
pdc |
motorola |
avalon |
| ms |
vb |
acrobat |
xaml |
|
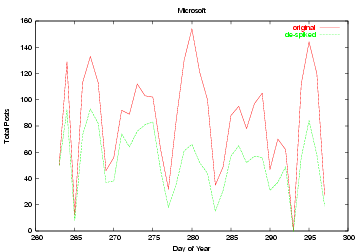
For these terms, we looked at their occurrences, and defined a
spike as an area where the posts in a given day exceeded
 + 2
+ 2 . We then extended the area to either side until a
local minimum less than the mean was reached. We refer to posts
during these intervals as spike posts. Now, having
identified the top coverage terms, we deleted spike posts related
to one of the identified terms from the Microsoft topic. The
results are plotted in Figure . The
de-spiked posts line shows a considerable reduction in the spikes
of the Microsoft graph, with minor reduction elsewhere. Note that
even in the spiky area we are not getting a complete reduction,
suggesting we may not have found all the synonymous terms for those
spike events, or that subtopic spikes may be correlated with a
latent general topic spike as well.
. We then extended the area to either side until a
local minimum less than the mean was reached. We refer to posts
during these intervals as spike posts. Now, having
identified the top coverage terms, we deleted spike posts related
to one of the identified terms from the Microsoft topic. The
results are plotted in Figure . The
de-spiked posts line shows a considerable reduction in the spikes
of the Microsoft graph, with minor reduction elsewhere. Note that
even in the spiky area we are not getting a complete reduction,
suggesting we may not have found all the synonymous terms for those
spike events, or that subtopic spikes may be correlated with a
latent general topic spike as well.
Figure: The topic density
for posts on Microsoft, both before and after spike
removal.
|
|
This analysis in no way implies that the topics in
Table are atomic.
We also explored the subtopic ``Windows''--one of the subtopics
with better coverage--and looked at its decomposition. The proper
noun selection was performed as before, generating the term set in
Table .
There is some duplication of terms from Table , as the
topics ``Microsoft'' and ``Windows'' overlap significantly.
However, some terms unique to Windows appear, especially the
comparison to Apple (Apple, Steve Jobs, Quicktime, Mac, Macs,
Macintosh).
Table: Top coverage spike terms for
Windows. Terms on a grey background are also spike terms for
Microsoft (Table ).
| series |
|
os |
|
| pc |
|
mac |
gui |
| apple |
jobs |
dell |
ui |
| ram |
|
explorer |
drm |
| unix |
pcs |
linux |
apples |
|
macs |
quicktime |
macintosh |
|
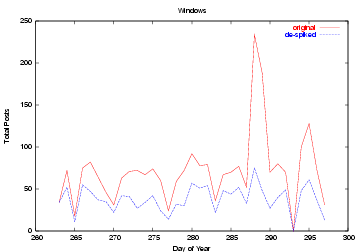
Applying these terms to the Windows posting frequency, we see the
results in Figure . Again, we
see a similar reduction in spikes, indicating that we have found
much of the spiky behavior of this topic. As might be expected with
a more focused topic, the top 24 spike terms have better coverage
for ``Windows'' than for ``Microsoft,'' leaving a fairly uniform
chatter.
Figure: The topic density
for posts on Windows, both before and after spike
removal.
|
|
This case study strongly supports our notion of a spike and chatter
model of blog posting. While not presented here, similar behavior
was observed in a number of other topics (terrorism, Linux, the
California recall election, etc.).
4.2.3 Characterization of Spikes
Having presented a qualitative decomposition of topics into chatter
and spikes, we now present measurements to quantify the nature of
these spikes. Each chatter topic can be characterized by two
parameters corresponding to the chatter level (distribution of the
number of posts per day) and the spike pattern (distribution of the
frequency, volume, and shape of spikes). To perform these
evaluations, we hand-tagged a large number of topics into the
categories given in Section . Of those
hand-tagged topics, 118 fell into the chatter category; we
performed this characterization study on those topics. We used the
simple spike definition of Section to
determine where the spikes occurred in each chatter topic; an
examination of the spikes found by this algorithm led us to believe
that, while simple, it indeed captures our intuition for the spikes
in the graph. To begin, the average number of posts per day for
non-spike regions of our collection of chatter topics ranges
between 1.6 to 106. The distribution of non-spike daily average is
well-approximated by
Pr[average number of posts per day > x]  ce-x.
ce-x.
Figure: Distribution of
spike duration and period (spacing between two consecutive spike
centers) within chatter topics.
|
|
Next, we focus on characteristics of spike activity.
Figure shows the
distribution of the duration of spikes, as well as their
period, the interval from the center of one spike to the
next. Most spikes in our hand-labeled chatter topics last about
5-10 days. The median period between spike centers is about two
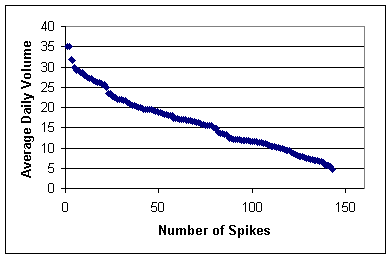
weeks. Figure shows the
distribution of average daily volume for spike periods. In addition
to the distribution shown in the figure, we observed that the
median spike among our chatter topics peaks at 2.7 times the mean,
and rises and falls with an average change of 2.14 times the mean
in daily volume.
Figure: Average daily
volume of spikes within chatter topics.
|
|
5 Characterization and Modeling of Individuals
We have covered the high-level statistical ``thermodynamic'' view
of the data in terms of aggregates of posts at the topic level; now
we turn to a view more akin to particle dynamics, in which we
attempt to uncover the path of particular topics through the
various individuals who make up blogspace. We begin in
Section by
categorizing individuals into a small number of classes, just as we
did for topics in the previous section. Next, in
Section we formulate
a model for propagation of topics from person to person through
blogspace, and we present and validate an algorithm for inducing
the model. Finally, we apply the model to real data, and give some
preliminary applications. Our model is akin to traditional models
of disease propagation, in which individuals become ``infected'' by
a topic, and may then pass that topic along to others with whom
they have close contact. In our arena, close contact is a directed
concept, since a may read the blog of b, but not vice
versa. Such a model gives a thorough understanding of how topics
may travel from person to person. Unfortunately, we do not have
access to direct information about the source that inspired an
author to post a message. Instead, we have access only to the
surface form of the information: the sequence in which hundreds,
thousands, or tens of thousands of topics spread across blogspace.
Our algorithm processes these sequences and extracts the most
likely communication channels to explain the propagation, based on
the underlying model.
5.1 Characterizing Individuals
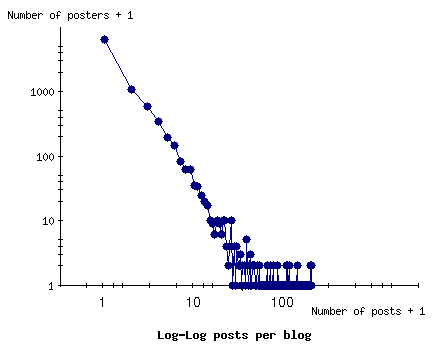
Figure: Distribution of
number of posts by user.
|
|
We begin with a quick sense of the textual output of our users.
Figure shows the
distribution of the number of posts per user for the duration of
our data-collection window. The distribution closely approximates
the expected power law [20].
Table: Life-cycle predicates on topics,
and the fraction of topics containing each region type.
| Predicate |
Algorithm |
Region |
% of topics |
| RampUp |
All days in first 20% of
post mass below mean, and average day during this period below
- /2. |
First 20% of post
mass. |
3.7% |
| Ramp-Down |
All days in last 20% of
post mass below mean, and average day during this period below
- /2. |
Last 20% of post mass. |
5.1% |
| Mid-High |
All days during middle 25%
of post mass above mean, and average day during this period above
+ /2. |
Middle 25% of post
mass. |
9.4% |
| Spike |
For some day, number of
posts exceeds
+ 2. |
From spike to inflection
point below , both directions. |
18.2% |
|
We now wish to classify these users. We adopt a simple set of
predicates on topics that will allow us to associate particular
posts with parts of the life cycle of the topic. Given this
information, we will ask whether particular individuals are
correlated with each section of the life cycle. The predicates are
defined in the context of a particular time window, so a topic
observed during a different time window might trigger different
predicates. See Table for the
definitions of these predicates, and the fraction of topics that
evince each of these regions. We can then attempt to locate users
whose posts tend to appear in RampUp, RampDown, MidHigh, or Spike
regions of topics. However, we must exercise caution in tracking
this correspondence: for example, we wish to avoid capturing users
who simply happened to post more frequently during the early part
of our data-collection window, and thus are more likely to post
during regions identified as RampUp by our predicates. We therefore
consider the probability pi that a post on day
i falls into a given category (e.g., RampUp). For any given
user, we then consider the pair (ti,
ci) of total posts on day i and posts in
the category on day i, respectively. The total number of
posts in the category is
C =  ci. We can then define a
``random'' user who contributes the same number of posts each day,
but does so without bias for or against the category. The expected
number of posts in the category for the random user is then
piti.
Because the random user produces a sum of independent random
variables, each of which is simply a series of Bernoulli trials
with some bias depending on the day, we can determine the
probability that the random user would produce C or more
posts in the category, and therefore determine the extent to which
we should be surprised by the behavior of the given user. We set
our threshold for surprise when the number of occurrences is more
than three standard deviations beyond the mean of the random user.
Using this technique, we give the number of users who are unusually
strong contributors to each region in Table . In some
cases, as for the Up region, the numbers are relatively low, but
the total number of posts in the region is also quite small. The
correlation is quite strong, leading us to suggest that evaluating
broader definitions of a ``ramp up'' phase in the discussion of a
topic may identify a larger set of users correlated with this
region. For regions such as Mid or Spike, the number of associated
users is quite substantial, indicating that there are significant
differing roles played by individuals in the life cycle of a
topic.
ci. We can then define a
``random'' user who contributes the same number of posts each day,
but does so without bias for or against the category. The expected
number of posts in the category for the random user is then
piti.
Because the random user produces a sum of independent random
variables, each of which is simply a series of Bernoulli trials
with some bias depending on the day, we can determine the
probability that the random user would produce C or more
posts in the category, and therefore determine the extent to which
we should be surprised by the behavior of the given user. We set
our threshold for surprise when the number of occurrences is more
than three standard deviations beyond the mean of the random user.
Using this technique, we give the number of users who are unusually
strong contributors to each region in Table . In some
cases, as for the Up region, the numbers are relatively low, but
the total number of posts in the region is also quite small. The
correlation is quite strong, leading us to suggest that evaluating
broader definitions of a ``ramp up'' phase in the discussion of a
topic may identify a larger set of users correlated with this
region. For regions such as Mid or Spike, the number of associated
users is quite substantial, indicating that there are significant
differing roles played by individuals in the life cycle of a
topic.
Table: Number of users associated with
each region.
| Region |
Up |
Down |
Mid |
Spike |
| Users with > 4 posts |
20 |
55 |
157 |
310 |
| and
> + 3 |
|
|
|
|
| Total posts this region |
1733 |
3300 |
12453 |
55624 |
|
5.2 Model of Individual Propagation
We derive our formal model from the Independent Cascade model of
Goldenberg et al. [13], which has been
generalized by the General Cascade Model of Kempe et
al. [17]. We are given a set
of N nodes, corresponding to the authors. At the initial
state of each episode, some possibly empty set of nodes have
written about the topic. At each successive state, some possibly
empty set of authors write about the topic. We present the model in
the SIR framework, in which authors do not write multiple postings
on the topic; then in Section we
consider an extension into the more accurate SIRS framework,
allowing authors to write repeatedly on the same topic. We consider
the episode to be over when no new articles appear for some number
of time steps, the timeout interval. Under the Independent
Cascade Model, the authors are connected by a directed graph, where
each edge (v, w) is labeled with a copy
probability
 . When author
v writes an article at time t, each node w
that has an arc from v to w writes an article about
the topic at time t + 1 with probability
. This
influence is independent of the history of whether any other
neighbors of w have written on the topic. The General
Cascade Model can be seen as generalizing this by eliminating the
assumption of independence. We introduce the notion that a user may
visit certain blogs frequently, and other blogs infrequently. We
capture this with an additional edge parameter ru,
v, denoting the probability that u reads v's
blog on any given day. Formally, propagation in our model occurs as
follows. If a topic exists at vertex u on a given day--i.e.,
u has previously written about the topic--then we compute
the probability that the topic will propagate from u to a
neighboring vertex v as follows. Node v reads the
topic from node u on any given day with reading probability
ru, v, so we choose a delay from an exponential
distribution with parameter ru, v. Then, with
probability
. When author
v writes an article at time t, each node w
that has an arc from v to w writes an article about
the topic at time t + 1 with probability
. This
influence is independent of the history of whether any other
neighbors of w have written on the topic. The General
Cascade Model can be seen as generalizing this by eliminating the
assumption of independence. We introduce the notion that a user may
visit certain blogs frequently, and other blogs infrequently. We
capture this with an additional edge parameter ru,
v, denoting the probability that u reads v's
blog on any given day. Formally, propagation in our model occurs as
follows. If a topic exists at vertex u on a given day--i.e.,
u has previously written about the topic--then we compute
the probability that the topic will propagate from u to a
neighboring vertex v as follows. Node v reads the
topic from node u on any given day with reading probability
ru, v, so we choose a delay from an exponential
distribution with parameter ru, v. Then, with
probability
 , the author of
v will choose to write about it. If v reads the topic
and chooses not to copy it, then v will never copy that
topic from u; there is only a single opportunity for a topic
to propagate along any given edge. Alternatively, one may imagine
that once u is infected, node v will become infected
with probability
ru,
v on any given day, but once the ru, v coin
comes up heads, no further trials are made. See Section
for some extensions to the model. Thus, given the transmission
graph (and, in particular, each edge's reading frequency r
and copy probability
, the author of
v will choose to write about it. If v reads the topic
and chooses not to copy it, then v will never copy that
topic from u; there is only a single opportunity for a topic
to propagate along any given edge. Alternatively, one may imagine
that once u is infected, node v will become infected
with probability
ru,
v on any given day, but once the ru, v coin
comes up heads, no further trials are made. See Section
for some extensions to the model. Thus, given the transmission
graph (and, in particular, each edge's reading frequency r
and copy probability  ), the
distribution of propagation patterns is now fully established.
Given a community and a timeout interval, our goal is therefore to
learn the arcs and associated probabilities from a set of episodes.
Using these probabilities, given the initial fragment of a new
episode, we would like to be able to predict the propagation
pattern of the episode. =1
), the
distribution of propagation patterns is now fully established.
Given a community and a timeout interval, our goal is therefore to
learn the arcs and associated probabilities from a set of episodes.
Using these probabilities, given the initial fragment of a new
episode, we would like to be able to predict the propagation
pattern of the episode. =1
5.3 Induction of the Transmission Graph
In the following, we make a closed world assumption that all
occurrences of a topic except the first are the result of
communication via edges in the network. In Section ,
we discuss weakening this assumption by introducing an ``outside
world'' node into the model. A topic in the following is a
URL, phrase, name, or any other representation of a meme that can
be tracked from page to page. We gather all blog entries that
contain a particular topic into a list
[(u1,
t1),(u2,
t2),...,(uk,
tk)] sorted by publication date of the blog,
where ui is the universal identifier for blog
i, and ti is the first time at which blog
ui contained a reference to the topic. We refer
to this list as the traversal sequence for the topic. We
wish to induce the relevant edges among a candidate set of
 (n2)
edges, but we have only limited data. We shall make critical use of
the following observation: the fact that blog a appears in a
traversal sequence, and blog b does not appear later
in the same sequence gives us evidence about the (a,
b) edge--that is, if b were a regular reader of
a's blog with a reasonable copy probability, then sometimes
memes discussed by a should appear in b's blog. Thus,
we gain information from both the presence and absence of entries
in the traversal sequence. We present an EM-like algorithm to
induce the parameters of the transmission graph [8], in which we first compute a ``soft
assignment'' of each new infection to the edges that may have
caused it, and then update the edge parameters to increase the
likelihood of the assigned infections. Assume that we have an
initial guess at the value of r and for each edge, and we wish to improve our estimate
of these values. We adopt a two-stage process:
(n2)
edges, but we have only limited data. We shall make critical use of
the following observation: the fact that blog a appears in a
traversal sequence, and blog b does not appear later
in the same sequence gives us evidence about the (a,
b) edge--that is, if b were a regular reader of
a's blog with a reasonable copy probability, then sometimes
memes discussed by a should appear in b's blog. Thus,
we gain information from both the presence and absence of entries
in the traversal sequence. We present an EM-like algorithm to
induce the parameters of the transmission graph [8], in which we first compute a ``soft
assignment'' of each new infection to the edges that may have
caused it, and then update the edge parameters to increase the
likelihood of the assigned infections. Assume that we have an
initial guess at the value of r and for each edge, and we wish to improve our estimate
of these values. We adopt a two-stage process:
- Soft-Assignment Step:
- Using the current version of the transmission graph, compute
for each topic and each pair (u, v) the probability
that the topic traversed the (u, v) edge.
- Parameter-Update Step:
- For fixed u and v, recompute ru,
v and
based on the
posterior probabilities computed above.
We are given as input the traversal sequence for a particular topic
j. For each v in the sequence, we consider all
previous vertices u in the sequence, and compute the
probability pu, v that topic j would have
been copied from u to v, given the delay between
u and v in the sequence. We then normalize by the sum
of these probabilities to compute posteriors of the probability
that each node u was v's source of inspiration. That
is, setting
r = ru, v,
= , and  to be the delay in days between u and v in topic
j:
to be the delay in days between u and v in topic
j:
pu, v : =
.
In practice, for efficiency reasons, we consider only the 20 values
of w closest to v, and require propagation to occur
within 30 days.
We perform the following operation for each fixed u and
v. Let S1 denote the set of topics
j such that topic j appeared first at node u
and subsequently at node v, and let S2
denote the set of topics j such that u was infected
with topic j but v was never infected with the topic.
For each topic j
S1, we require as input the pair
(pj, ),
where pj is the posterior probability computed
above that u infected v with topic j, and
is the delay in
days between the appearance of the topic in u and in
v. For every topic j
S2, we require as input the value , where days elapsed between the appearance of topic
j at node u and the end of our snapshot. We can then
estimate an updated version of r and as follows:
where
Pr[a
),
where pj is the posterior probability computed
above that u infected v with topic j, and
is the delay in
days between the appearance of the topic in u and in
v. For every topic j
S2, we require as input the value , where days elapsed between the appearance of topic
j at node u and the end of our snapshot. We can then
estimate an updated version of r and as follows:
where
Pr[a  b] = (1 -
a)(1 - (1 - a)b) is the probability that a
geometric distribution with parameter a has value
b. (Given the
pj's, the updated 1/r is the expected
delay in topics copied from u to v, and the updated
is the ratio of the
expected number of topics at u copied by v to the
expected number of such topics read by v.)
We now have an improved guess at the transmission graph, so we can
return to the soft-assignment step and recompute posteriors,
iterating until convergence. In the first step, we use our model of
the graph to guess how data traveled; in the second, we use our
guess about how data traveled to improve our model of the graph.
For our data sets, the values of r and converge within 2-5 iterations, depending on the
data, to a vector of values within 1% of the limiting value under
the L2 norm.
b] = (1 -
a)(1 - (1 - a)b) is the probability that a
geometric distribution with parameter a has value
b. (Given the
pj's, the updated 1/r is the expected
delay in topics copied from u to v, and the updated
is the ratio of the
expected number of topics at u copied by v to the
expected number of such topics read by v.)
We now have an improved guess at the transmission graph, so we can
return to the soft-assignment step and recompute posteriors,
iterating until convergence. In the first step, we use our model of
the graph to guess how data traveled; in the second, we use our
guess about how data traveled to improve our model of the graph.
For our data sets, the values of r and converge within 2-5 iterations, depending on the
data, to a vector of values within 1% of the limiting value under
the L2 norm.
5.4 Extensions to the Model
The real world. Most blog topics do not travel
exclusively through blogspace; rather, they are real-world events
that are covered to some extent in traditional media. During online
coverage of the topic, certain bloggers may read about the topic in
other blogs and respond, while others may read about the topic in
the newspaper and write without reference to other blogs. Our model
can be extended by introducing a ``real world'' node, which we view
as writing about a topic whenever that the topic is covered
sufficiently in the media. Transmission probabilities and delays
are handled just as before, though we assume that essentially all
bloggers will receive input from this ``real world'' node.
Span of attention. Blogging communities can become
quite large, and most people do not have the time to read more than
a few blogs on any regular basis. This phenomenon can be modeled
either by limiting the in-degree of nodes, or by allowing only some
small number of in-edges to influence a particular node at any time
step. We can extend the model to support this phenomenon by adding
an attention threshold parameter. More sophisticated models
can capture the fact that the attention threshold is a function of
the other episodes that are occurring at the same time--the more
concurrent episodes, the lower the attention threshold for each
episode. This can explain the phenomenon that during high-chatter
events like the Iraq war or the California elections, many other
topics that would otherwise have received a lot of attention in
fact received little. The algorithm to learn the graph would
require significant modification to incorporate these changes.
Stickiness. As described above, the probability that
a node v will be infected with topic j by a node
u in our model depends only on the parameters
ru, v and
, and is
independent of the topic itself. Realistically, certain topics are
inherently more interesting than others, and thus are more likely
to be copied. To extend the model, we introduce the
stickiness Sj of each topic j that
controls the probability that the topic will ``stick'' with
v. The probability of infection when v reads
u's blog now becomes
Sj instead of just
. (Stickiness
of a topic is analogous to virulence of a disease.) Our
algorithm for inducing parameters of the induction graph requires
only minor modification for the updating of p, r, and
if we knew the
Sj's, but we still must compute or induce the
stickiness values. Often we can employ outside information, such as
empirical data on the popularity of a particular topic. Stickiness
can also be learned from the model using a maximum likelihood
estimation. However, the likelihood equations appear quite
complicated, and the estimation would be computationally expensive.
We have not pursued this direction.
Multiple Posts. In our domain, authors routinely
write multiple posts on the same topic. The framework presented
above extends naturally to this case, except that traversal
sequences of the form
[(u1,
t1),(u1,
t2),(u3,
t3),...] are possible. Thus, in estimating copy
probabilities and delays r,
we must consider the disjoint events that u3
received the information from the first instance of
u1, or the second instance. The relevant
expectations must now be taken over multiple instances of u,
but the equations are otherwise unchanged. The experiments
described below, however, simply assume that the reader of a blog
will respond to the most recent post on a particular topic, rather
than to a prior post.
5.5 Validation of the Algorithm
In order to validate the algorithm, we created a synthetic series
of propagation networks, ran each synthetic network to generate
observable sequences of infection by particular topics, and then
ran our mining algorithm to extract the underlying propagation
network. The synthetic graphs are modified Erdös-Renyi random
graphs: a number of vertices n is fixed, as is a target
degree d.1 Each vertex selects d
out-neighbors uniformly with replacement from the vertex set; all
parallel edges and self-loops are then removed. Each edge is then
given an
(r,) value; we used
r = 2/3 and
= 1/10 for our tests. We
began with a synthetic graph with n = 1000 and d =
3. For this graph, we performed multiple trials of a synthetic
benchmark in which a topic begins at a single vertex, and then
propagates according to a model. The number of trials per vertex
ranged from 20 to 60. We refer to this benchmark below as the
``impulse response topics.'' Due to the small value of , between 2 and 6 topics
originating from each vertex propagate to at least one other
vertex, on average. We considered only edges that were traversed by
at least three topics with probability at least 0.1. We then
compared the resulting edge set against the edge set from the
original propagation network. An edge was counted as erroneous if
it appeared in only one of those two graphs--i.e., we penalize for
both missing edges and unnecessary edges. The algorithm requires
little data to infer the correct edges: once it saw 6 topics per
node on average, it correctly inferred 2663 of the 3000 edges, plus
4 erroneous additional edges. For this benchmark, the algorithm
converges in two iterations. The mean and standard deviation of the
inferred values of r and
for this experiment are shown in Table .
Table: Mean and standard deviation for
r and in low-traffic
synthetic benchmark. Correct values:
r = 0.66, = 0.1.
| Topics per node |
 |
 |
 |
 |
| 2 |
0.718 |
0.175 |
0.141 |
0.455 |
| 4 |
0.703 |
0.157 |
0.107 |
0.039 |
| 6 |
0.694 |
0.134 |
0.103 |
0.034 |
|
Next, we turn to a propagation model with higher degrees in which
topics tend to take off and propagate throughout the graph, making
it more difficult to learn exactly how the information had
traveled. The parameters are n = 500, d = 9, and we
take 20 topics per node. Topic sizes range from 1 to slightly over
200. The estimated r values have mean 0.73 and standard
deviation 0.12; the values
have mean 0.08 and standard deviation 0.03. The system identifies
almost all relevant edges (to within 1%), and identifies a further
almost 9% spurious edges due to the more complex structure of this
task. Thus, both the edges and the estimated parameters of the
edges are very close to the underlying model.
5.5.2 Validation and Analysis for Real Data
Now that we have validated the algorithm on synthetic data, we
validate the model itself against our data. We run the graph
induction algorithm as described above on all the ProperName
sequences in our dataset. As we have seen, roughly 20% of these
sequences contain spikes, and fewer than 10% contain RampUp and
RampDown areas. So the dataset consists of both signal and noise.
Rather than introducing a ``real world'' node to modeling
communication through the general media, we restrict our attention
to topics for which at least 90% of the occurrences are in
blogspace, rather than in our RSS media content. This focuses on
about 7K topics. To validate that the model has in fact discovered
the correct edges, we performed two experiments. First, we
downloaded the top 100 blogs as reported by http://blogstreet.com. Of the 100 blogs, 70
of them were in our RSS-generated dataset. We then used the model
to rank individual nodes of the network based on the amount of
traffic flowing through those nodes. Of the 70 nodes in our
dataset, 49 were in the top 10% of blogs in our analysis; 40 were
in the top 5%, and 24 were in the top 1.2%. As a second validation,
we ranked all edges in the final model by the expected number of
topics that flowed down the edge, and produced the top 200. We
hand-examined a random sample of this set, and in 90% of the cases
were able to find a link between the two blogs. Note that we were
able to make use of the structure of blogspace in the discovery of
these links (i.e., blogrolls, and userids appearing inline), while
the algorithm did not have access to these mechanisms, and made its
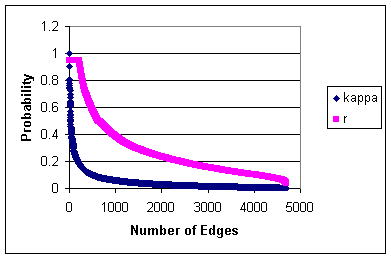
determinations based on topics alone. Figure
shows the distributions of r and as learned by the algorithm on the approximately 7K
topics described above. Most edges have an expected propagation
delay (1/r) of fewer than 5 days; the mean r is 0.28
and the standard deviation is 0.22. Copy probabilities are quite
low, with mean 0.04 and standard deviation 0.07, indicating that
even bloggers who commonly read from another source are selective
in the topics they choose to write about.
Figure: Distribution of
Inverse Mean Propagation Delay (r) and Copy Probability
() for RSS data.
|
|
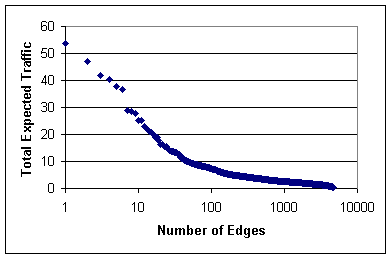
Figure: Expected Traffic
over 7K episodes for RSS data.
|
|
Figure shows the
distribution of expected traffic along each edge; i.e., over the
set of 7K given topics, for a particular edge (a, b),
how many times does b read about something on a and
consequently write about it? The iteration converges to about 4000
edges with traffic. Popular edges might have 50 expected copies;
the median edge has 1-2 total expected messages that traverse it.
5.6 Nature of the Induced Transmission Graph
Now that we have learned the transmission graph from real data, we consider two
quick analyses of its nature.
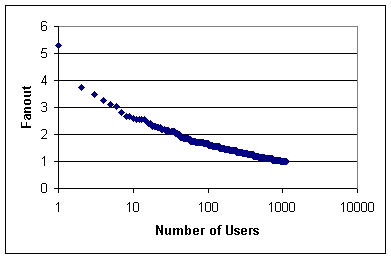
Certain individuals are likely to pass topics on to many friends,
while others never see a follow-on response. We can measure the
expected number of follow-on infections generated by each person in
the graph; we refer to this number as the fanout. Most users
leave the topic with less energy than it arrived, transmitting to
an expected less than one additional person, as we would expect;
thus, very few topics reach resonance and cover blogspace through
grassroots channels. Some users, however, provide a boost to every
topic they post about--over time, these are the users who can have
significant impact on a community, or even on blogspace overall.
The fanout results are shown in Figure .
The point to the very left of the graph with fanout 5.3 is a
standout; she is a classic ``connector'' in the sense of The
Tipping Point [12]
with a huge collection of friends, a broad set of interests, and an
intelligent and up-to-date blog.
Figure: Fanout per
individual
|
|
We may ask further whether any individuals tend to be more strongly
associated with topics that begin to take off. If we consider the
random set of ``impulse response'' topics from the previous
section, there are 357 of them that reach more four or more users.
Although the topics have been started at all possible start points
in the graph, and on average hit only 5 users, there is nonetheless
a single user who is present in 42 of the 357 episodes. Similarly,
there are 18 users present in at least 20 of the 357 episodes--as
has often been pointed out, marketers would do well to understand
these 18 users.
In this section, we adopt a broader perspective and sketch some
possible domains in which a better understanding of the flow of
information through networks might be a powerful tool.
News Services Over the past few years, we have seen the
launch of a number of alert-based news services, which attempt to
filter the large volume of online news items and identify a small
number of important, high-impact stories relevant to a given topic.
The explosion in the volume of news items poses a significant
challenge for making these services useful. Weblogs compound this
problem: while some blog postings may be sufficiently important to
merit notification, it can be difficult to identify the crucial
posts in high-chatter topics. (Corporate press releases pose a
similar problem: while some press releases are important and
newsworthy, the vast majority are comparatively irrelevant
marketing propaganda.) Sites like DayPop [7] attempt to track spikes, but the
lack of a topic structure reduces their value. Our topic model
contributes to a solution for this problem by enabling us to
identify subtopics that are experiencing spikes. Such an approach
leverages the blogging community's reaction to external world
events, as manifested by spikes in blog postings, to identify news
events that are worthy of attention. We believe that this view of
the blogging community--as a giant collaborative filtering
mechanism built around an implicit web of trust, as manifested in
propagation patterns between individuals--offers great
potential.
Marketing Weblogs offer an excellent, inexpensive, and
nearly real-time tool for evaluating the effectiveness and health
of a company's image and image-affecting activities. The ability to
perform such evaluations in the real world (and not in experimental
focus groups) can be a powerful and--given the substantial
marketing expenditures of many organizations--important tool. For
example, a company launching a new advertising campaign can gain
significant value from being able to judge (and thus, hopefully,
increase through tuning) the effectiveness of the campaign. To the
extent that the blogging community is representative of the target
audience for such a campaign, marketers can measure uptake of key
messages by defining and tracking the appropriate topics. The topic
model might be used in the development of public relations
campaigns, as well. Typically a company has a wide variety of
distinct possible emphases for an advertisement or a press release,
and must select one of these directions. As discussed previously,
high-chatter topics tend to exhibit larger spikes; thus choosing to
emphasize a high-chatter (sub)topic can increase the likelihood of
the message eliciting a large reaction. The chatter level on a
topic can potentially also be used for keeping tabs on the
``mindshare'' that a company has. As illustrated in our examples
and case studies, high visibility companies such as Microsoft and
Apple exhibit a high chatter level; tracking this chatter could
provide an early view of trends in share and perception.
Resonance Resonance is the fascinating phenomenon in which a
massive response in the community is triggered by a minute event in
the real world. It is an extremely rare phenomenon; we were
surprised to find even a few instances of resonance in our data
set. Understanding what causes resonance in networks like blogspace
is an interesting future direction for research, from both the
computational and the sociological perspective. The observation of
the spontaneous generation of order from chaos is not new [26], but perhaps the access to blog data
can shed new insight on this type of phenomenon. Resonance is the
marketeers' Holy Grail [12]; a better understanding of
the cause of resonance would have massive implications for
marketing.
- 1
- Rakesh Agrawal and Ramakrishnan Srikant.
Mining sequential patterns.
In Proc. ICDE, pages 3-14, 1995.
- 2
- Réka Albert, Hawoong Jeong, and Albert-László
Barabási.
Error and attack tolerance of complex networks.
Nature, 406, July 2000.
- 3
- J. Allan, editor.
Topic Detection and Tracking: Event-based Information
Organization.
Kluwer, 2002.
- 4
- Norman Bailey.
The Mathematical Theory of Infectious Diseases and its
Applications.
Griffin, London, 2nd edition, 1975.
- 5
- Venkatesh Bala and Sanjeev Goyal.
A strategic analysis of network reliability.
Review of Economic Design, 5:205-228, 2000.
- 6
- Béla Bollabas and Oliver Riordan.
Robustness and vulnerability of scale-free random graphs.
Internet Mathematics, 1(1), 2003.
- 7
- Daypop.
http://www.daypop.com.
- 8
- A. Dempster, N. Laird, and D. Rubin.
Maximum likelihood from incomplete data via the EM algorithm.
J. Royal Stat. Soc., 1977.
- 9
- Jared Diamond.
Guns, Germs, and Steel.
Random House, 1997.
- 10
- Víctor M. Eguíluz and Konstantin Klemm.
Epidemic threshold in structured scale-free networks.
Physical Review Letters, 89, 2002.
cond-mat/0205439.
- 11
- Michelle Girvan, Duncan S. Callaway, M. E. J.
Newman, and Steven H. Strogatz.
A simple model of epidemics with pathogen mutation.
Phys. Rev. E, 65(031915), 2002.
nlin.CD/0105044.
- 12
- Malcolm Gladwell.
The Tipping Point: How little things can make a big
difference.
Little Brown & Co., 2000.
- 13
- Jacob Goldenberg, Barak Libai, and Eitan Muller.
Talk of the network: A complex systems look at the underlying
process of word-of-mouth.
Marketing Letters, 12(3):211-223, 2001.
- 14
- Mark Granovetter.
Threshold models of collective behavior.
American Journal of Sociology, 83(6):1420-1443, 1987.
- 15
- R. V. Guha and Rob McCool.
TAP: A system for integrating web services into a global knowledge
base.
- 16
- Hans Haller and Sudipta Sarangi.
Nash networks with heterogeneous agents.
Working Paper Series E-2001-1, Virginia Tech, 2003.
- 17
- David Kempe, Jon Kleinberg, and Éva Tardos.
Maximizing the spread of influence through a social network.
In Proc. KDD, 2003.
- Andrew King.
The evolution of RSS.
http://www.webreference.com/authoring/languages/xml/rss/1/.
- 19
- Ravi Kumar, Jasmine Novak, Prabhakar Raghavan, and Andrew
Tomkins.
On the bursty evolution of blogspace.
In Proc. WWW, 2003.
- 20
- M. Mitzenmacher.
A brief history of lognormal and power law distributions.
In Allerton Comm. Control Comput., 2001.
- 21
- Cristopher Moore and M. E. J. Newman.
Epidemics and percolation in small-world networks.
Phys. Rev. E, 61:5678-5682, 2000.
cond-mat/9911492.
- 22
- Stephen Morris.
Contagion.
Review of Economic Studies, 67, 2000.
- 23
- M. E. J. Newman.
The spread of epidemic disease on networks.
Phys. Rev. E, 66(016128), 2002.
cond-mat/0205009.
- 24
- M. E. J. Newman, Stephanie Forrest, and Justin
Balthrop.
Email networks and the spread of computer viruses.
Phys. Rev. E, 66(035101), 2002.
- 25
- Romauldo Pasto-Satorras and Alessandro Vespignani.
Epidemic spreading in scale-free networks.
Phys. Rev. Letters, 86(14):3200-3203, April
2001.
- 26
- Steven Strogatz.
Sync: The emerging science of spontaneous order.
Hyperion, 2003.
- 27
- Topic Detection and Tracking (TDT-2003).
http://www.nist.gov/TDT.
- 28
- D. Watts and S. Strogatz.
Collective dynamics of `small-world' networks.
Nature, 393:440-442, 1998.
- 29
- WebFountain.
http://www.almaden.ibm.com/WebFountain/.
- 30
- Fang Wu, Bernardo A. Huberman, Lada A. Adamic, and
Joshua R. Tyler.
Information flow in social groups.
Manuscript, 2003.
- 31
- H. Peyton Young.
The diffusion of innovation in social networks.
Sante Fe Institute Working Paper 02-04-018, 2002.
Footnotes
- 1
- We validate the model on these simple graphs; future work
involves validation on other graph types, such as synthetic
power-law graphs.

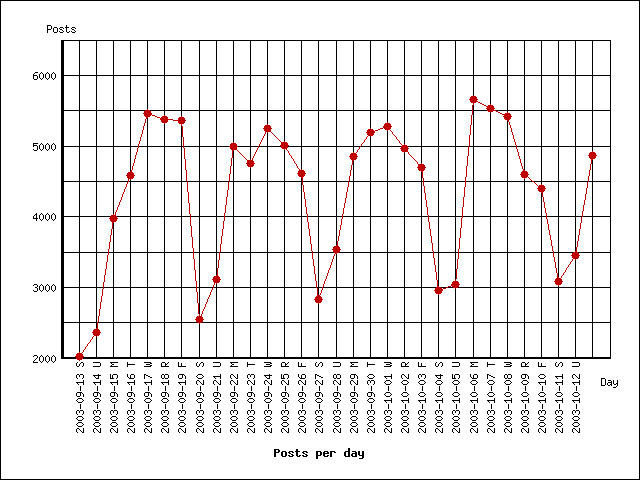

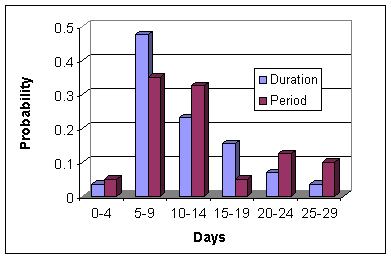

![$\displaystyle {\frac{{\sum_{j \in S_1} p_j}}{{\sum_{j\in S_1 \cup S_2}\Pr[r\leq\delta_j]}}}$](p417-gruhl-img23.png)